Observing prethermal dynamical phase transitions on QuEra Aquila with Amazon Braket
This post was contributed by Katherine Klymko, Alexey Khudorozhkov, Pedro L. S. Lopes, Milan Kornjača, Tommaso Macrì, Trevor Chaloux, and Peter Komar.
What happens when interacting quantum particles are suddenly pushed far from equilibrium? Can their motion settle into long-lived patterns, and can those patterns undergo abrupt transitions of their own? In a new Nature study [1], researchers from NERSC at Lawrence Berkeley National Laboratory, QuEra Computing, Harvard University, and Boston University explored these questions. The experiments revealed long-lived prethermal regimes, resonances that cause them to “melt,” and a first-order dynamical phase transition that is not inherited from the system’s known equilibrium phase diagram.
The NERSC-QuEra collaboration combined experiments on QuEra’s Aquila, accessed through Amazon Braket, with theoretical analysis and classical calculations on NERSC’s Perlmutter supercomputer. Aquila’s programmability made it possible to systematically vary the interactions, control fields, geometry, and size of the atomic arrays. Unexpected features in the resulting maps became questions for theory and numerical simulation, turning an exploratory experiment into a quantitative investigation of new quantum dynamics.
This is quantum simulation in “discovery mode”: mapping how a system behaves, identifying unexpected features, and developing explanations that can be tested against further measurements. In this post, we explain what motivated the experiments, how the team ran them on Aquila through Amazon Braket, and what they found.
The scientific question
Physicists have a mature understanding of how quantum systems organize into equilibrium phases and transition between them. Much of our capacity to explain low-temperature phenomena in magnetism, superconductivity, and other phases and the transitions between them is built on this body of knowledge. Technologies such as the superconducting magnets in magnetic resonance imaging (MRI) scanners and the magnetic materials in hard disk drives rely on this kind of physics.
To access these phases, we often simulate a slow cooling of the system in contact with a much larger low-temperature environment. Alternatively, we start the system in its ground state and change the system parameters slowly during simulation to study how the ground state reorganizes. Over the past decade, analog neutral-atom quantum simulators have been successfully used to study this type of phenomenon in a controlled setting, with early demonstrations in refs. [2, 3].
Alternatively, one can change the parameters abruptly in an operation known as a quench. Much as a blacksmith quenches steel by plunging it into cold water, we rapidly change the magnetic fields, strain, or other control knobs of the system. This rapid disturbance generates a complex transient response, which dies out at long times as equilibrium is reestablished. Most often, quantum systems re-equilibrate as if they had been put in contact with a finite-temperature reservoir of energy, like a big water bath at a specific temperature. Sometimes, however, a system displays stable average dynamical behavior that cannot be described by equilibrium, or thermal, physics.
Previous experiments have already revealed striking departures from ordinary thermalization, including persistent oscillations associated with quantum many-body scars [4, 5]. Here, the NERSC-QuEra team pursued a broader map: how does the long-time response change across different interaction strengths and control fields, which dynamical regimes persist, and where do they break down? Analog devices have been used to describe adiabatically prepared phases and to study dynamics on some of those phases, but the long-time behavior of strongly interacting quantum systems after a quench had not been mapped systematically.
These questions matter beyond fundamental physics: knowing which non-equilibrium regimes are long-lived, and where they break down, can inform how quantum simulations on future digital hardware are designed and benchmarked.
The experiment on Aquila
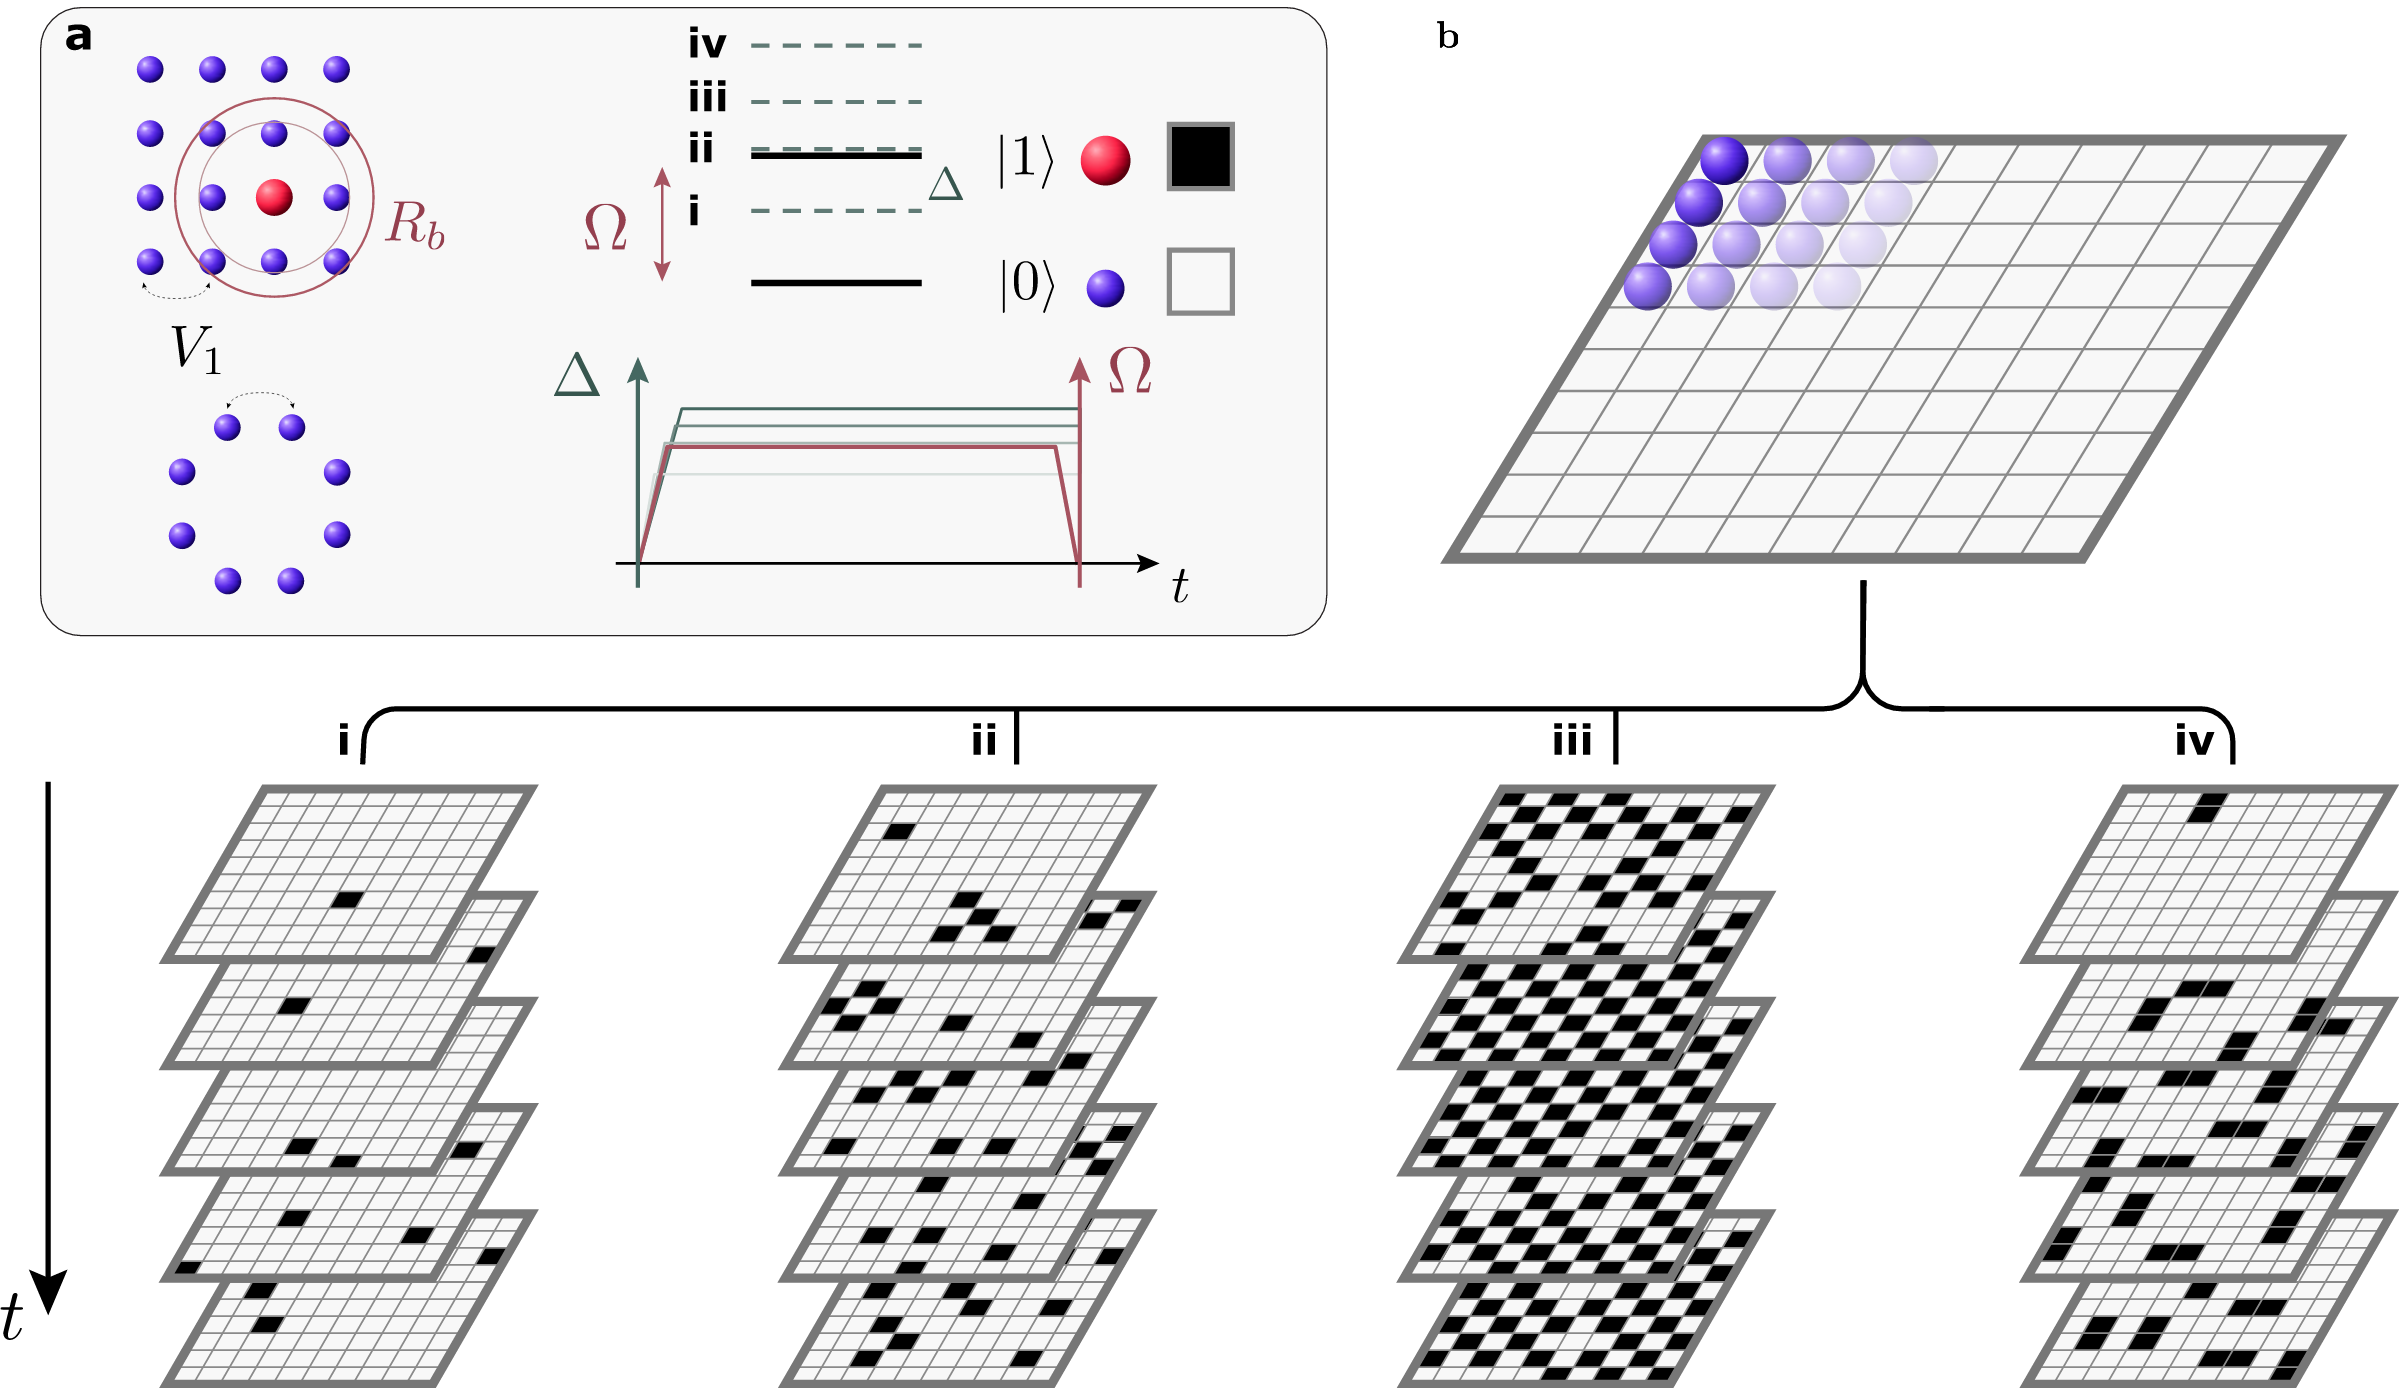
The experimental sequence on Aquila was simple: prepare every atom in its electronic ground state, abruptly switch on the laser drive and detuning, and let the system evolve; repeating this with different evolution times and measuring the atoms’ states produced the time series data. This data made it possible to reconstruct the dynamics and calculate time-averaged observables after the initial transient. By varying the atom spacing and detuning, the NERSC-QuEra team mapped how excitation densities, correlations, and cluster patterns changed across the parameter space. The same approach was applied to one-dimensional chains of up to 52 atoms and two-dimensional arrays of up to 180 atoms.
Figure 1 – The experimental setup and the regimes it reveals. (a) Rubidium atoms are arranged in square grids (2D) or chains (1D) and driven by constant quenches in the detuning Δ and Rabi frequency Ω. Ground states (purple spheres, white tiles) and Rydberg-excited states (red spheres, black tiles) interact with a strength set by the blockade radius Rb. (b) Starting from the all-ground state, excitations proliferate until the system reaches a non-equilibrium steady state. As the detuning quench increases, the spatial excitation patterns evolve from (i) isolated excitations, to (ii) mixed-excitation domains, to (iii) large, defect-rich checkerboards, and (iv) at still higher detunings, isolated multi-excitation islands. The takeaway: a single, hardware-native protocol produces qualitatively distinct, stable dynamical regimes.
Aquila is programmed using the analog Hamiltonian simulation (AHS) paradigm: instead of applying a sequence of gates, users specify the atom positions and the time-dependent laser drive directly. Through Amazon Braket, the team ran quenches from a simple product state (all atoms in the ground state) under the strong interactions created by the Rydberg blockade [6]. The flexibility of geometric and dynamic control allowed the team to methodically vary the strength of the interactions (Rb/a, where Rb is the blockade radius and a is the lattice constant) and the quenched effective magnetic field (Δ), let the system evolve long enough to remove transients, average the results, and chart a map of the mean behaviors observed in one- and two-point spin correlators.
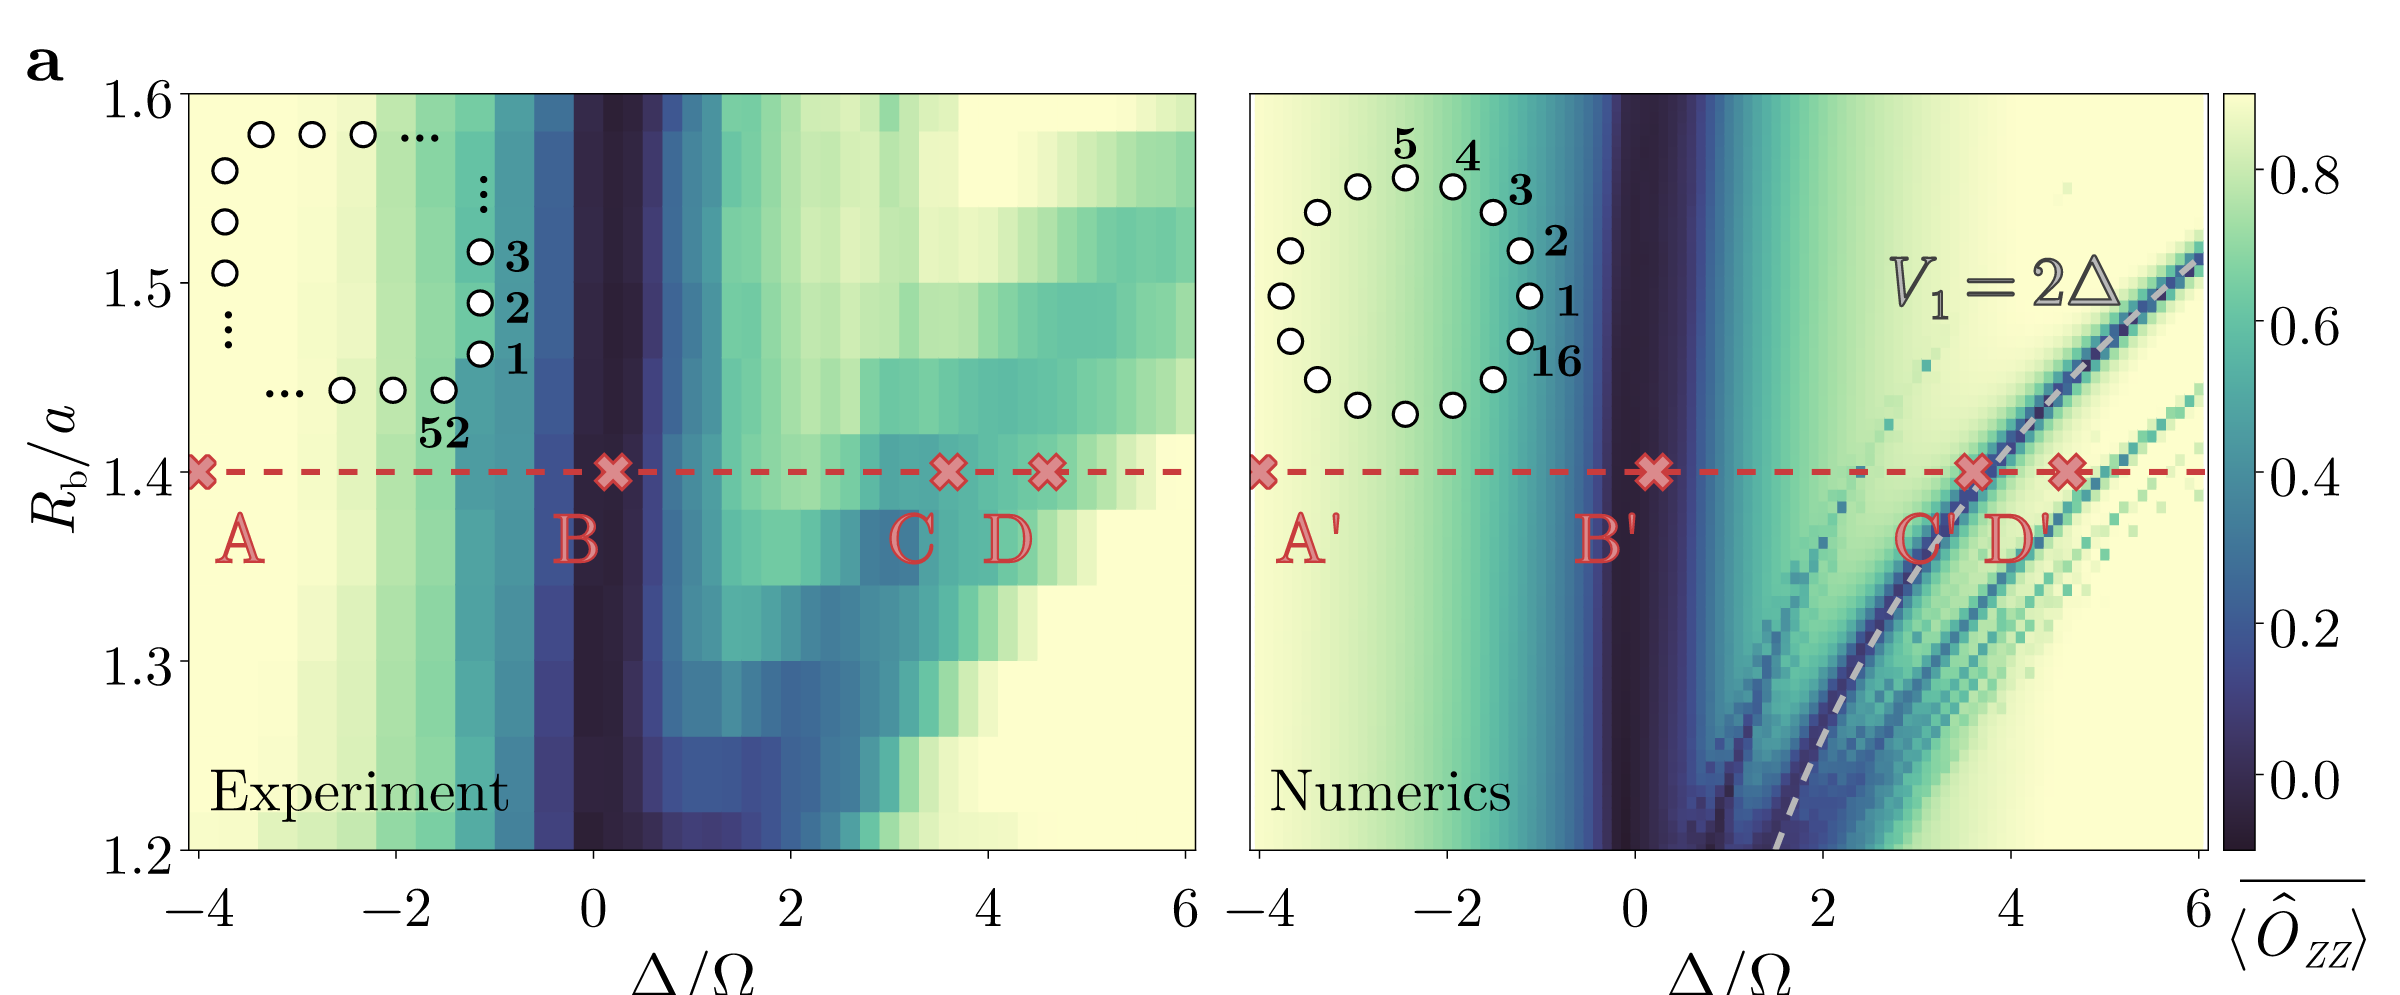
Figure 2 – Dynamical phase diagrams of the 1D chain from experiment (left, 52 atoms) and numerics (right, 16 atoms), showing the time-averaged two-site correlator ⟨OZZ⟩ as a function of Δ/Ω and Rb/a. The red dashed line marks the representative cut at Rb/a = 1.4. Distinct, well-defined regimes appear that do not match the known equilibrium phase diagram of the same system: a broad central region near Δ/Ω ≈ 0 and a curved series of side features at larger detuning.
Even in the one-dimensional case, the time-averaged correlators settled into stable regimes, and those regimes did not match the well-studied equilibrium phase diagram. Establishing the physics behind them, and later the phase transition in two dimensions, required tracking quantum dynamics over long evolution times, measuring correlations in two-dimensional arrays, and examining how the results changed with system size, up to 180 qubits.
Prethermal regimes and resonant melting in one dimension
The one-dimensional map contained a broad central region and a curved series of features at larger detuning. What sustained these patterns? Classical calculations supplied an important diagnostic: compare the measured correlations with thermal predictions, both for the full system and for a restricted set of configurations obeying the nearest-neighbor Rydberg blockade. For negative Δ, the measurements agreed with the full thermal prediction. Beyond the central peak, that agreement broke down, and follows a different trend instead. In the central region, the restricted description captured the response much better. The system was behaving as though it had equilibrated within the configurations permitted by an effective constraint, without reaching thermal equilibrium for the full Hamiltonian.
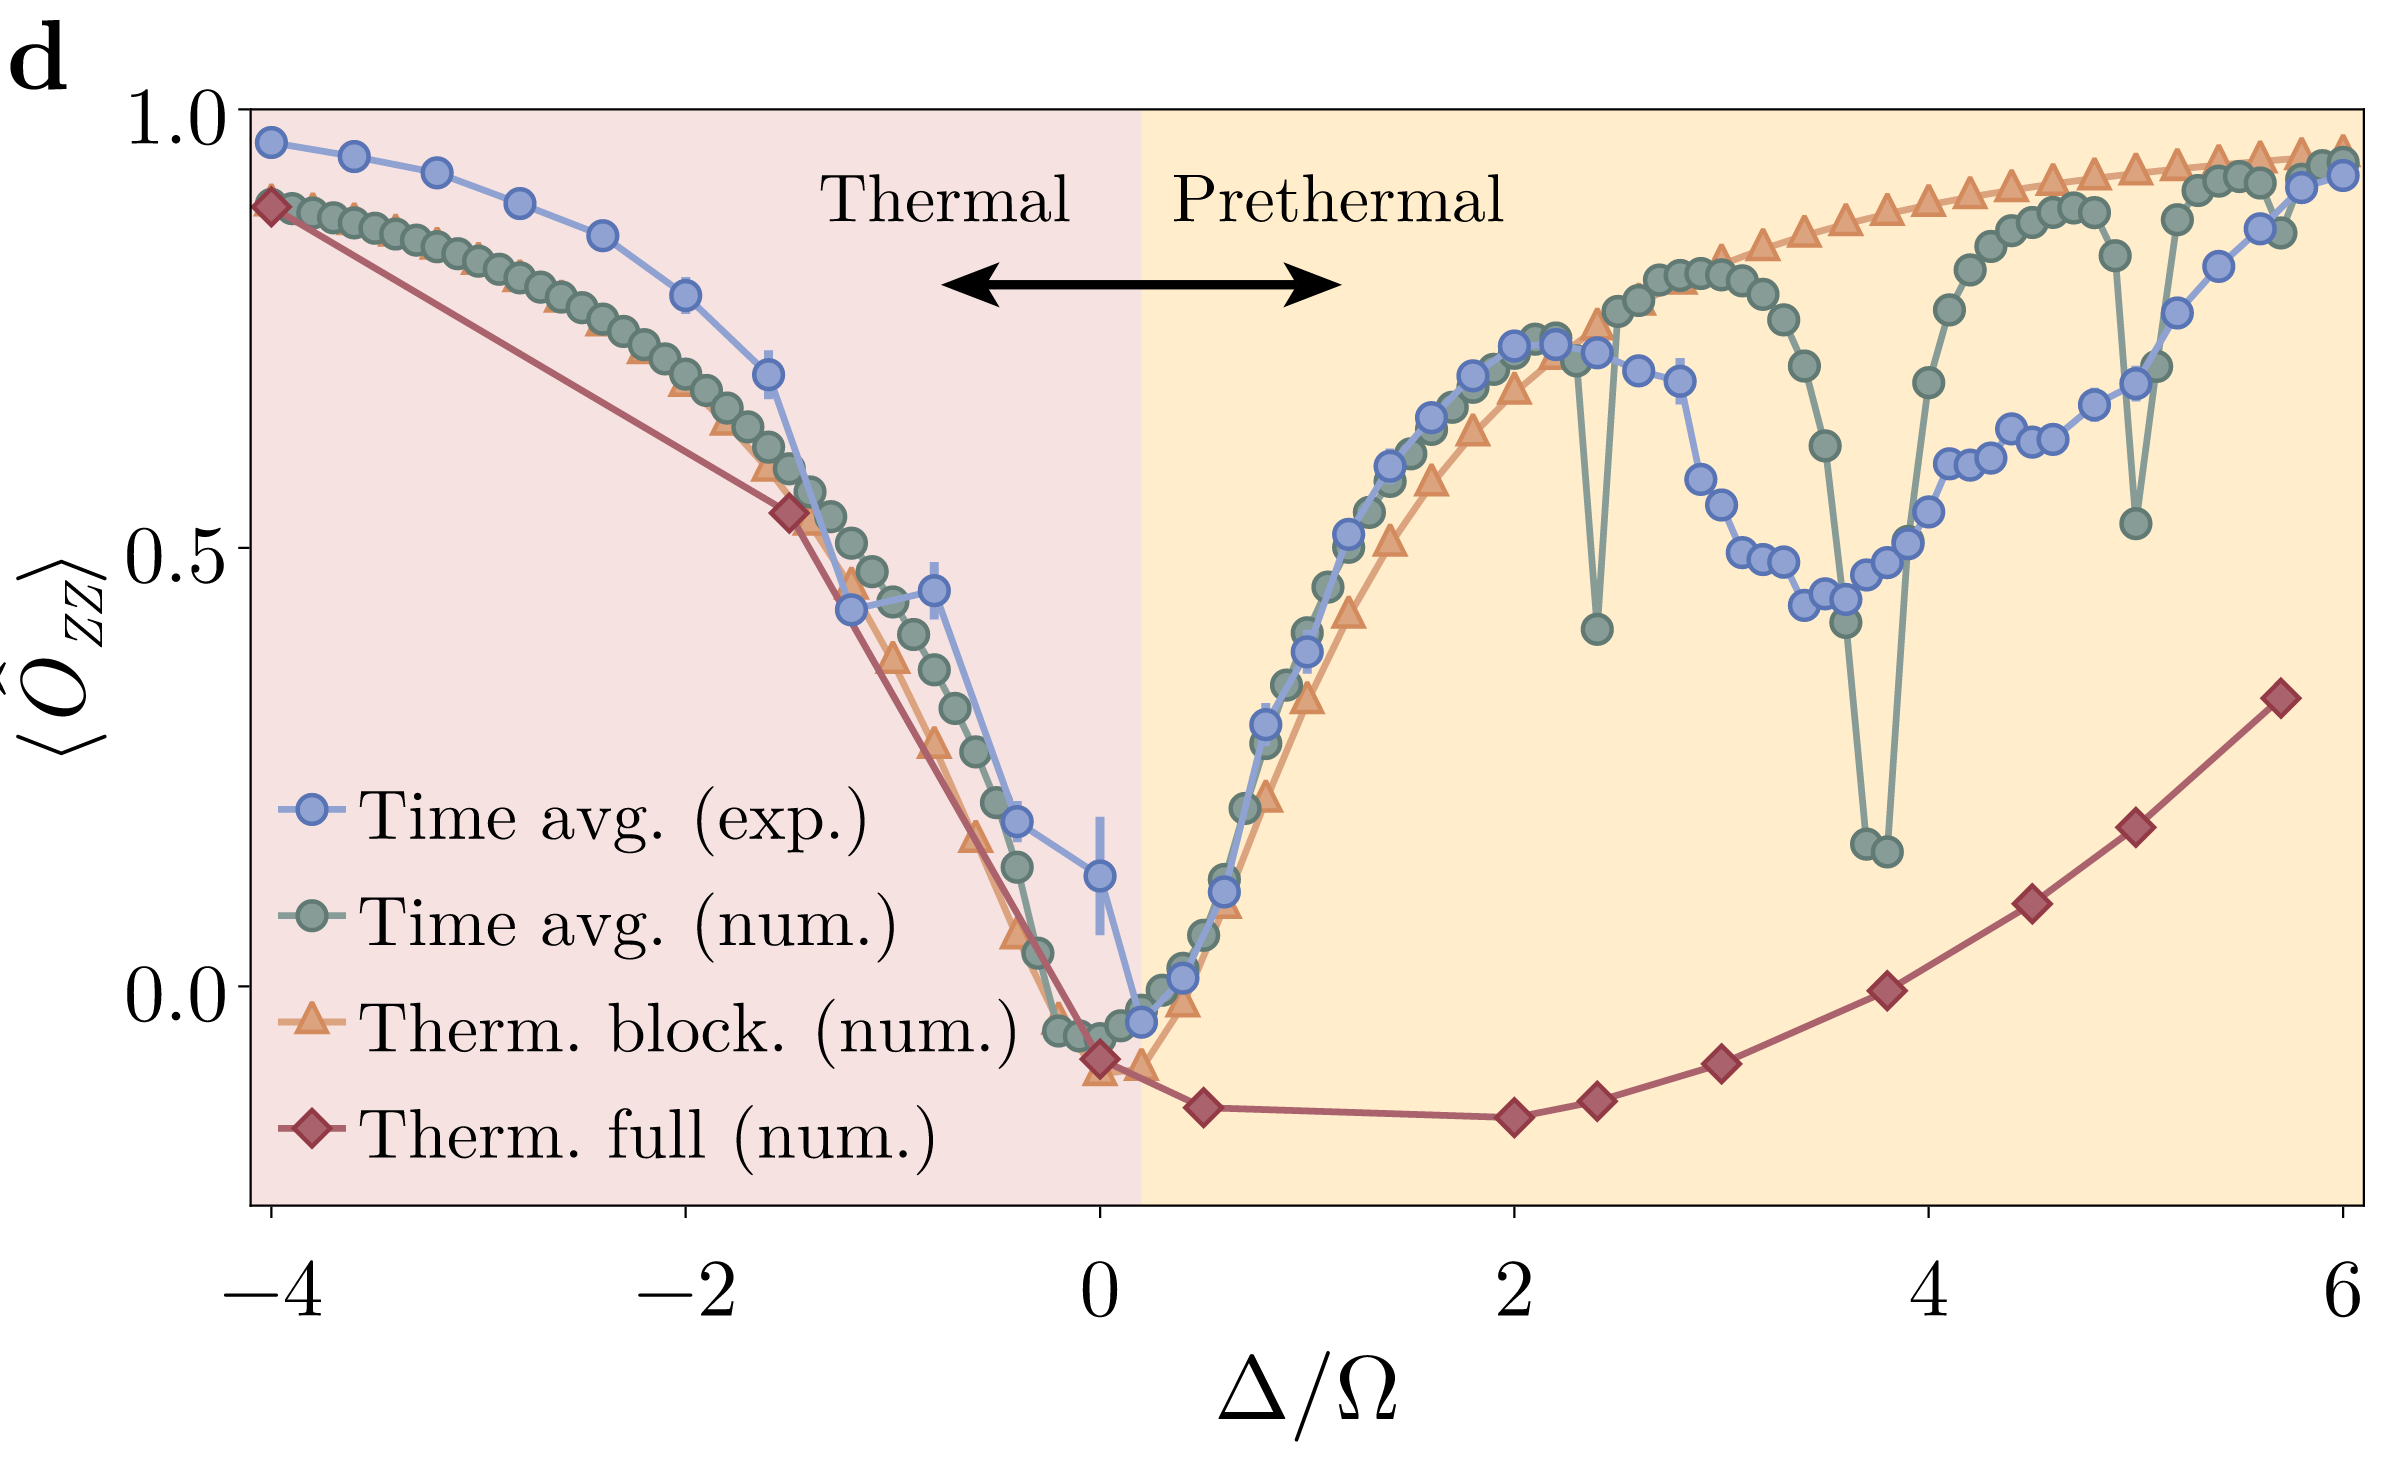
Figure 3 – The representative cut at Rb/a = 1.4. Blue and green points are time-averaged values of ⟨OZZ⟩ from experiment and numerics. The orange and red curves are thermal expectation values at the effective temperature of the quench, computed within the nearest-neighbor blockade subspace (orange) and in the full Hilbert space (red). For negative detuning, the data follow the full thermal curve; past the central peak they follow the blockade-constrained thermal curve instead. The sharp dips in the numerics are the resonances discussed below.
Strong Rydberg interactions suppress the simultaneous excitation of nearby atoms. This effectively confines the dynamics to a restricted set of configurations, allowing a long-lived intermediate, or prethermal, regime to emerge. The constraints are not absolute, however: processes that violate them eventually become important. Measuring the density of such violations provided a direct experimental test. Their observed exponential suppression with increasing interaction strength supported the theoretical picture of a regime protected against rapid relaxation.
At particular detunings, configurations containing small groups, or “islands,” of neighboring excited atoms become resonant with the initial configuration. These resonances open pathways that are otherwise strongly suppressed, causing the prethermal description to break down. This is the resonant melting seen in the dynamical map (Fig. 2), and it corresponds to the intersections with the curved side structure. Numerics resolved several discrete peaks where the experiment showed a broader feature, indicating that the side structure is richer and more discrete than the experimental resolution reveals. Calculations identified the excitation patterns responsible for the different resonances, while measurements sensitive to island size resolved their signatures experimentally. The breakdown was therefore not featureless: it had a structure that could be predicted and tested.
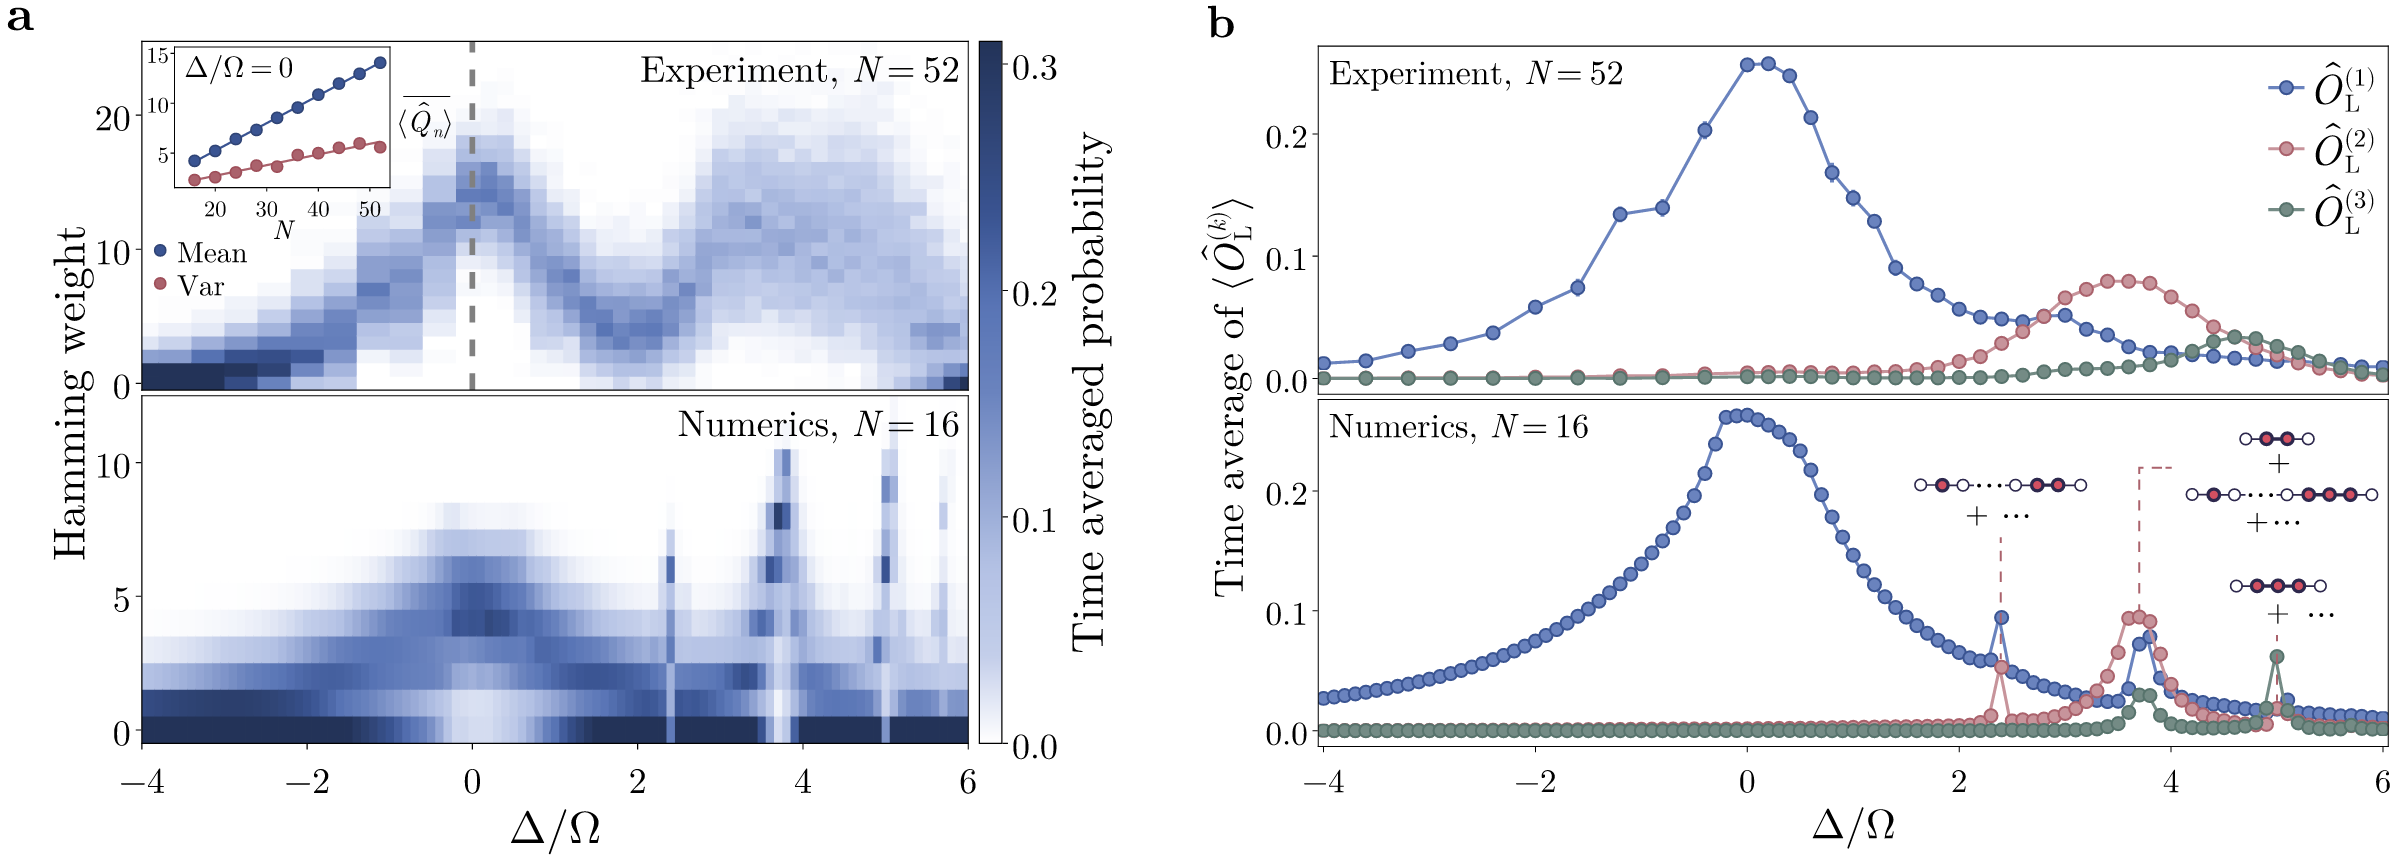
Figure 4 – Experimental characterization of the central region and the resonances. (a) The Hamming weight (number of excitations) distribution of post-quench states along the Rb/a = 1.4 cut, from experiment (52 atoms) and numerics (16 atoms). At Δ/Ω = 0, the mean scales as N/4 and the variance as N/8 (inset), consistent with equal excitation probability across the blockade subspace. (b) Time-averaged k-island observables for k = 1, 2, 3 resolve the fan of side peaks: each peak coincides with a resonance between the energy of a specific island pattern and the initial state. The takeaway: the melting of the prethermal regime happens through identifiable, predictable channels rather than a featureless crossover.
The theory of quantum thermalization suggests that thermal behavior in dynamics breaks down at specific resonance points. Together with the discrete peaks, this made clear that resonances were at play. The final piece came from the structure of the Hamiltonian itself. The dominant nearest-neighbor van der Waals interaction has an integer-spaced spectrum, and the remaining terms act on it much like a periodic drive. In this Floquet-like picture, the system relaxes to a prethermal regime governed by the blockade constraint and remains there for exponentially long times before eventually thermalizing in the full quantum state space. This prethermalized state, and its melting via resonances, which the team tracked down perturbatively as groups of excited islands of 2, 3, or more excitations, provided an explanation of the observed one-dimensional physics.
A first-order dynamical phase transition in two dimensions
The next question was whether the one-dimensional picture carried over to two dimensions. When the experiments were scaled to a two-dimensional square lattice of up to 180 atoms, numerical simulations for smaller sizes, the prethermalization and resonant-melting picture reappeared. The large-size experimental data also revealed something new.
The response associated with checkerboard-like excitation patterns developed a sharp boundary. Filtering excitation patterns to 1-islands of Néel-type excitations, the team found that the peak weight shifted as the system grew, up to a point beyond which it appeared to converge. As the arrays grew, this boundary sharpened and its position approached a stable limit. The behavior suggested a first-order dynamical phase transition: an abrupt change between distinct prethermal regimes, rather than a transition between the familiar equilibrium phases of the system. The transition edge is located where the all-zero state becomes resonant with the Néel state, ΔNeel = 2V2, and at finite size this shifts to the left due to boundary effects.
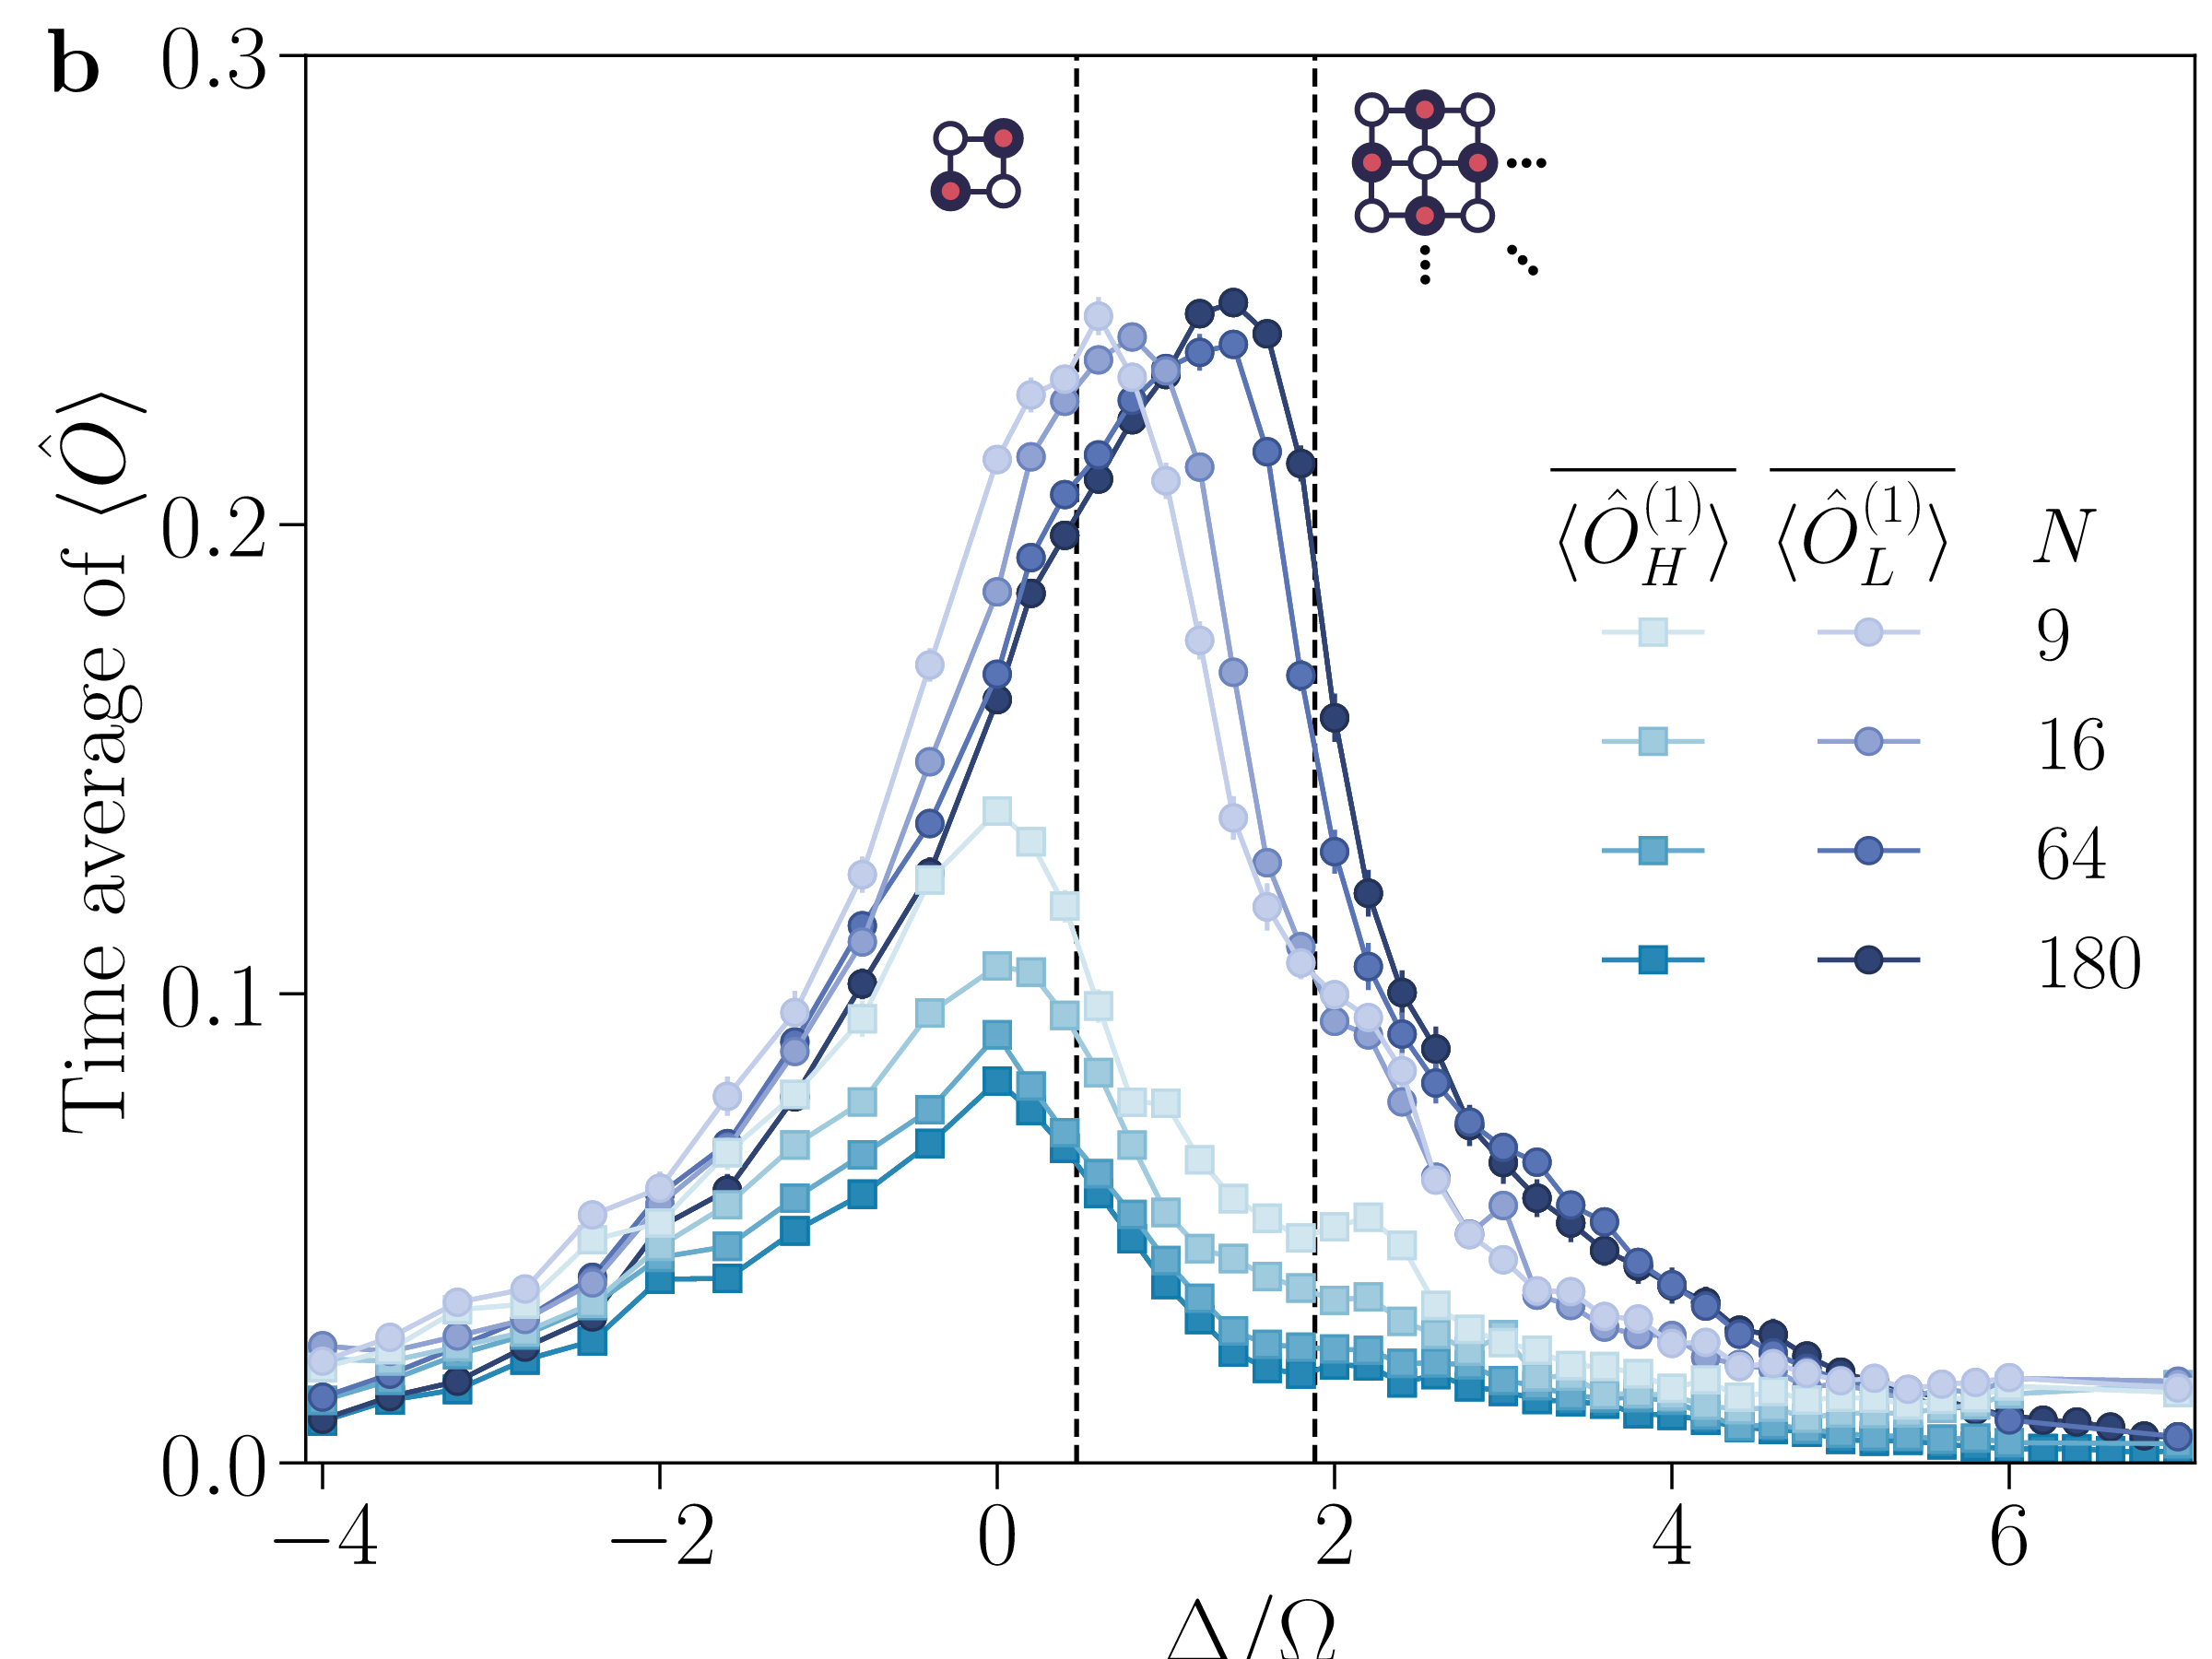
Figure 5 – Time-averaged 1-island observables on the Rb/a = 1.4 cut for 2D lattices of 9, 16, 64, and 180 atoms. The dashed vertical lines mark the detunings corresponding to the smallest and largest resonant Néel-order patches in the classical limit. As the system grows, the right-hand edge of the central peak sharpens and converges toward a fixed position. The takeaway: the sharpening with system size is the signature expected of a phase transition in the thermodynamic limit, here occurring in a prethermal regime rather than in equilibrium.
A sharp boundary alone was not enough to establish the first-order character of the transition. To test it, the researchers developed a generalization of the Clausius-Clapeyron relation, familiar from thermodynamics, which connects the shape of a phase boundary to changes in measurable properties across it. Applied to the effective thermodynamics of the prethermal regime, it made it possible to compare two independently measured quantities: the slope of the transition boundary and the ratio of changes in excitation density and correlations.
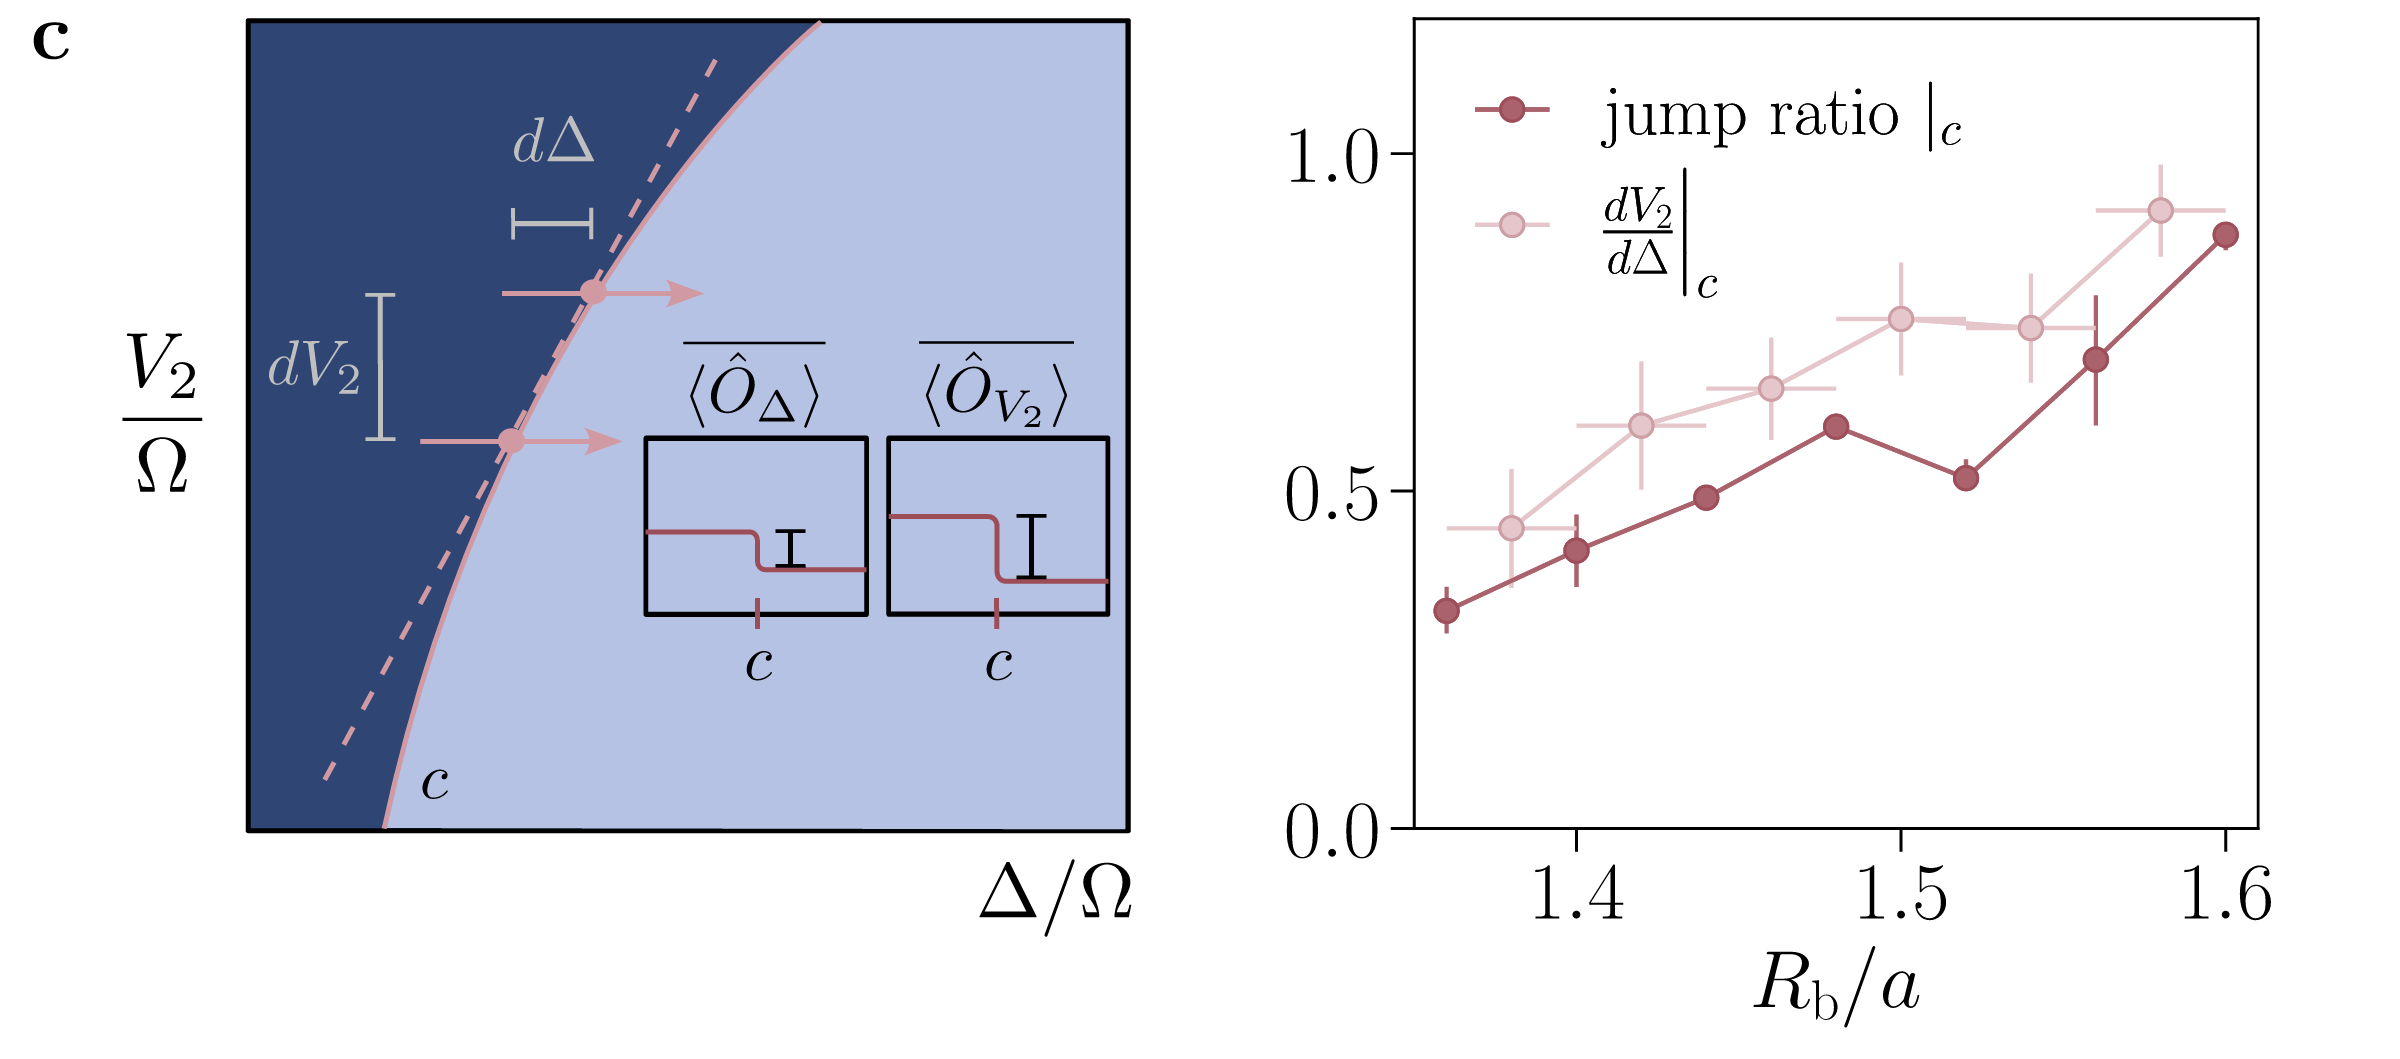
Figure 6 – The Clausius-Clapeyron test. Left: the transition boundary (c) in the plane of detuning Δ and second-neighbor interaction V2, both in units of Ω. The relation connects the slope of this boundary, dV2/dΔ, to the ratio of the jumps across the transition in the excitation density ⟨OΔ⟩ and the second-neighbor correlations ⟨OV2⟩ (insets). Right: the two independently measured quantities, the jump ratio at the transition (dark) and the boundary slope (light), as a function of Rb/a. They agree within uncertainties across the range studied. The takeaway: the measured transition satisfies the consistency relation expected of a first-order phase boundary, here in a long-lived prethermal regime rather than in equilibrium.
Agreement between these quantities, together with the system-size dependence, provided quantitative evidence for a first-order dynamical transition. Moreover, both quantities sit well away from the classical crossing value of 1/2, indicating that quantum effects shape the transition. The important distinction is that this phase structure emerges during a long-lived stage of the evolution, rather than following the known equilibrium phase boundary. Prethermalization does more than delay relaxation: it allows distinct forms of collective quantum behavior, and a transition between them, to become experimentally observable.
Quantum simulator plus supercomputer
Classical computation was integral to interpreting the observations. NERSC’s Perlmutter supercomputer supported exact-diagonalization calculations using Bloqade.jl, alongside tensor-network simulations and other numerical analyses. These calculations tested thermal and prethermal descriptions, resolved the microscopic structure of the resonances, and helped assess how system size and experimental imperfections affected the measured response.
The collaboration illustrates a familiar scientific process carried out with a programmable quantum simulator: observations motivate hypotheses, calculations sharpen those hypotheses, and further measurements test them. The discovery was ultimately driven by the Aquila data; although no tight coupling between the quantum processor and the classical resources was needed for this workflow, efficient access to both Aquila and Perlmutter’s high-performance computing resources was essential.
Discovery mode, and from Aquila to Libra
Operating a quantum simulator in discovery mode means using its programmability to investigate unfamiliar behavior, while subjecting the results to the same scrutiny as any other scientific experiment. Reliable conclusions come from reproducible measurements, comparisons across parameters and system sizes, and quantitative tests of the proposed explanations. Much of the work in quantum simulation to date has focused on reproducing known physics in known regimes to a desired accuracy. This work shows a different way a research-grade quantum computer can be operated: use its natural capacity to reach regimes that are hard to access otherwise, then pursue research-grade analysis with the tools that have long supported it: theoretical insight, connection with the literature, and classical numerical simulation. The NERSC-QuEra collaboration shows how this approach can turn unexpected observations into new physical understanding.
Looking toward fault-tolerant platforms such as QuEra’s Libra (Coming to Braket in 2028), greater flexibility and improved error control could extend this approach to a wider range of models and dynamical regimes. The prospect is not simply to repeat today’s experiments on larger machines, but to ask new scientific questions. What else might we discover as fault-tolerant quantum computers allow us to explore beyond the constraints of today’s analog simulators?
Conclusion
This work demonstrates that, with careful programming and post-processing, Aquila can be used to produce scientific results that shed light on previously hidden regimes of dynamical systems. A hardware-native quench, repeated across interaction strengths, detunings, geometries, and system sizes, revealed long-lived prethermal regimes, resonant melting, and a first-order dynamical phase transition with no equilibrium analog.
To get started:
- Read the paper: Observation of prethermal dynamical phase transitions and resonant melting, Nature (2026), https://doi.org/10.1038/s41586-026-11225-9; preprint at arXiv:2510.11706.
- Explore Aquila on Amazon Braket and the AHS examples in the Amazon Braket examples repository.
References
[1] S. Darbha et al., “Observation of prethermal dynamical phase transitions and resonant melting,” Nature (2026). https://doi.org/10.1038/s41586-026-11225-9. Preprint: arXiv:2510.11706.
[2] P. Schauß et al., “Crystallization in Ising quantum magnets,” Science 347, 1455–1458 (2015). https://doi.org/10.1126/science.1258351
[3] H. Bernien et al., “Probing many-body dynamics on a 51-atom quantum simulator,” Nature 551, 579–584 (2017). https://doi.org/10.1038/nature24622
[4] A. Hudomal et al., “Ergodicity breaking meets criticality in a gauge-theory quantum simulator,” arXiv:2512.23794 (2025). https://arxiv.org/abs/2512.23794
[5] T. Macrì, Z. Papić, M. Kornjača, and A. Hudomal, “Science with QuEra: Ergodicity breaking meets criticality in a gauge-theory quantum simulator,” webinar, February 10, 2026. quera.com/events
[6] P. Lopes, A. Keesling, M. Lin, and P. Komar, “Optimization with a Rydberg atom-based quantum processor,” AWS Quantum Technologies Blog, November 10, 2022. aws.amazon.com/blogs/quantum-computing