How to Generate Synthetic Healthcare Data Using Synthea: A Hands On Tutorial
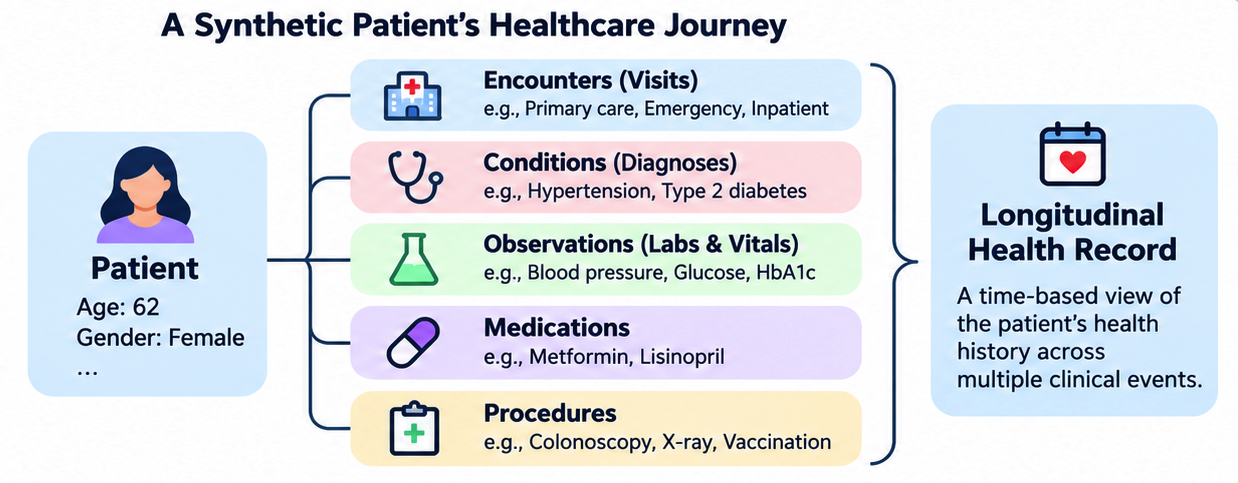
Healthcare generates huge amounts of data every day, from patient visits and lab results to diagnoses, medications, and medical imaging.
For developers and data engineers building healthcare applications, access to realistic patient data is essential. Whether you are building a healthcare analytics pipeline, testing an Electronic Health Record (EHR) system, or experimenting with machine learning, you need data that reflects how healthcare systems actually work.
But there is a challenge: real patient data is sensitive, highly regulated, and often difficult to access. So how can we develop and test healthcare applications without exposing real patient information? One solution is to generate synthetic healthcare data.
In this tutorial, you will learn how to use Synthea, an open-source synthetic patient generator, to create realistic patient records. We'll generate a population of approximately 100 patients, explore the resulting healthcare datasets using Python, and reconstruct a patient's clinical history.
By the end, you will have your own synthetic healthcare dataset that you can use for learning, testing, and prototyping.
I have also included a companion Jupyter notebook that you can use to explore the generated data with Python, visualize clinical events, and understand a synthetic patient's healthcare journey.
What We'll Cover:
- 1. What Is Synthetic Healthcare Data?
- 2. What Is Synthea?
- 3. Prerequisites
- 4. How to Install Synthea
- 5. How to Generate 100 Synthetic Patients
- 6. Understanding the Generated Healthcare Dataset
- 7. How to Explore Synthetic Healthcare Data with Python
- 8. Reconstructing a Patient's Clinical Journey
- 9. How to Validate Your Synthetic Healthcare Dataset
- 10. Limitations of Synthetic Healthcare Data
- 11. Conclusion
1. What Is Synthetic Healthcare Data?
Synthetic healthcare data is artificially generated information designed to resemble real healthcare records without representing actual patients.
For example, a synthetic patient might have:
- Demographic information such as age and gender
- A history of primary care visits
- Diagnosed medical conditions
- Lab test results
- Prescribed medications
- Procedures and hospital visits
These records are generated using simulation models and predefined rules and not copied from real patient histories.
Synthetic Data vs. De-identified Data
It's important to understand the difference between these two types of data.
De-identified data starts with real patient records and removes or transforms identifying information, such as names, addresses, and other personal identifiers.
Synthetic data, on the other hand, is generated artificially. It doesn't directly represent an actual patient's medical history.
Synthetic data offers another way to create development and testing datasets without relying on actual patient records. But synthetic data isn't automatically statistically representative, clinically accurate, or free from bias.
Why is Synthetic Healthcare Data Useful?
Developers and researchers can use synthetic data in a variety of ways. It lets them develop and test healthcare applications, build data ingestion and transformation pipelines, and experiment with healthcare data models
They can also use it to test interoperability between healthcare systems, prototype analytics and machine learning workflows, and learn more about certain healthcare concepts and data relationships.
For this tutorial, we'll focus on generating structured healthcare data and understanding how the records relate to one another.
2. What Is Synthea?
Synthea is an open-source synthetic patient population simulator developed by MITRE.
Instead of generating random rows of patient information, Synthea simulates patient lifecycles. It models healthcare events over time, including medical conditions, clinical encounters, medications, procedures, and laboratory observations.
For example, a simulated patient might develop a medical condition, visit a healthcare provider, undergo testing, and receive medication. These events become part of that patient's longitudinal health record.
Synthea uses configurable clinical modules and population characteristics to generate these histories.
What Data Can Synthea Generate?
Synthea can generate many types of data, including:
| Healthcare data | Description |
|---|---|
| Patients | Demographics and patient identifiers |
| Encounters | Hospital visits, outpatient consultations, and emergency visits |
| Conditions | Diagnoses and clinical findings |
| Observations | Laboratory results, vital signs, and clinical measurements |
| Medications | Medication prescriptions and history |
| Procedures | Clinical procedures and interventions |
| Allergies | Recorded allergies |
| Immunizations | Vaccination records |
| Imaging studies | Medical imaging study metadata |
| Claims | Healthcare billing and insurance data |
Synthea supports several export formats, including CSV (which is useful for data analysis, SQL databases, and data engineering), HL7 FHIR (a standard for exchanging healthcare information between systems, commonly represented as JSON resources), and C-CDA (an XML-based format for exchanging clinical documents).
We'll use CSV in this tutorial because it's easy to explore with Python and can be imported into relational databases.
3. Prerequisites
Before getting started, you'll need:
- Java Development Kit (JDK) 17 or newer
- Git
- A terminal or command-line environment
- Python 3, for the exploration section
- Basic familiarity with CSV files and Python
Synthea recommends supported long-term-support Java versions, such as Java 17 or 25.
I'll demonstrate the commands using macOS, but the same general workflow works on Linux and Windows.
Check Your Java Installation
Open Terminal and run:
java -version You should see an installed Java version, for example:
openjdk version "17.x.x" Make sure you're using a JDK rather than only a Java Runtime Environment.
If Java isn't installed, download a compatible JDK before proceeding.
You can also check Git:
git --version And Python:
python3 --version 4. How to Install Synthea
Let's download the Synthea source code from its official GitHub repository.
Step 1: Clone the Repository
Open your terminal and execute:
git clone https://github.com/synthetichealth/synthea.git This downloads the Synthea project into a local directory.
Navigate into it:
cd synthea Step 2: Build the Project
Synthea is written in Java and uses Gradle for building the application.
Run:
./gradlew build The included Gradle wrapper handles the required Gradle version, so you don't need to install Gradle separately.
The first build may take some time because Gradle needs to download dependencies. When the build completes successfully, you're ready to generate patients.
On Windows, you can use gradlew.bat instead of ./gradlew.
Step 3: Check the Available Commands
Run:
./run_synthea -h This displays the available command-line options.
Some important options are:
| Argument | Purpose |
|---|---|
-p | Target population size |
-s | Random seed |
-r | Simulation reference date |
-a | Patient age range |
-g | Gender filter |
-o | Population overflow setting |
You can also modify configuration properties directly through command-line arguments.
We'll use these options in the next step.
5. How to Generate 100 Synthetic Patients
Now we'll generate our first synthetic healthcare population.
From your Synthea directory, execute:
./run_synthea -s 12345 -p 100 \ --exporter.csv.export=true Let's understand what the command does.
-s 12345sets the random seed used during data generation. Using a fixed seed helps make experiments reproducible.-p 100requests a population size of 100 patients.--exporter.csv.export=trueenables the CSV exporter.
This last option is important. Synthea's default configuration doesn't enable CSV export, so running it without this setting may leave you with FHIR files and metadata but no csv directory.
Why Use a Random Seed?
Suppose you're building a data engineering pipeline and repeatedly testing your transformations.
You want your input dataset to remain stable between runs. Using a fixed seed helps achieve this. For stronger reproducibility, also pin the Synthea version and fix the simulation's reference date.
For example, you can add:
-r 20261001 This sets the simulation reference date to October 1, 2026.
Reproducibility also depends on the generator version and configuration, and not every generated field is necessarily invariant across execution environments.
Where Are the Generated Files?
After Synthea finishes, you should see an output directory:
synthea/ │ ├── output/ │ ├── csv/ │ ├── fhir/ │ └── metadata/ │ ├── src/ ├── gradlew └── run_synthea The files of interest are inside:
output/csv/ You can list them using:
ls output/csv Depending on your version and configuration, you'll find files such as:
patients.csv encounters.csv conditions.csv observations.csv medications.csv procedures.csv allergies.csv immunizations.csv careplans.csv imaging_studies.csv claims.csv providers.csv organizations.csv Each CSV represents a different part of the simulated healthcare ecosystem.
Why Did Synthea Generate More Than 100 Patients?
Here's something interesting I noticed during my experiment. I requested a population of 100, but Synthea generated 115 patient records.
This happens because Synthea normally uses population overflow when generating its target population. The simulation may generate additional people when patients die before the reference date, so the exported records can include more than the requested number.
If you need exactly 100 generated patient records, you can disable overflow:
./run_synthea -s 12345 -p 100 \ -o false \ --exporter.csv.export=true But this changes how the target population is constructed. In particular, the demographics of the surviving population might no longer match the original population targets as closely.
For this tutorial, we'll keep the default behavior because it gives us a more representative example of how Synthea models a population.
6. Understanding the Generated Healthcare Dataset
Before analyzing anything, let's see how much data we've generated.
Run:
wc -l output/csv/*.csv This counts the number of lines in each CSV file.
Here's a selection from my generated dataset:
| File | Records |
|---|---|
| patients.csv | 115 |
| encounters.csv | 5,985 |
| conditions.csv | 4,070 |
| observations.csv | 75,004 |
| medications.csv | 4,454 |
| procedures.csv | 16,777 |
| imaging_studies.csv | 504 |
These figures come from one simulation run. Your results may differ depending on the version, seed, reference date, and configuration.
Notice something important: we generated a relatively small population, but it produced thousands of clinical events.
That's because a patient may have multiple healthcare encounters over their lifetime, and each encounter can generate several conditions, observations, medications, or procedures.
Understanding the CSV Relationships
Let's look at six important files.
1. patients.csv
Contains demographic and identifying information for each synthetic patient.
Some columns include:
Id BIRTHDATE DEATHDATE GENDER RACE ETHNICITY CITY STATE The Id column uniquely identifies a synthetic patient.
2. encounters.csv
Contains information about healthcare visits.
Important columns include:
Id START STOP PATIENT ENCOUNTERCLASS DESCRIPTION An encounter represents an interaction between a patient and the healthcare system. Examples include outpatient visits, emergency encounters, and hospital admissions.
The PATIENT column links each encounter back to a patient in patients.csv.
3. conditions.csv
Contains clinical conditions and diagnoses.
For example:
START STOP PATIENT ENCOUNTER SYSTEM CODE DESCRIPTION The SYSTEM and CODE columns identify the terminology system and clinical concept.
4. observations.csv
Contains clinical measurements, laboratory results, and other recorded observations.
Some columns include:
DATE PATIENT ENCOUNTER CATEGORY CODE DESCRIPTION VALUE UNITS TYPE Observations might include blood pressure, heart rate, glucose levels, or laboratory test results.
An important detail is that not every observation value is numeric. Some observations contain text.
5. medications.csv
Contains medication-related records associated with patients and encounters.
6. procedures.csv
Contains records of procedures performed during clinical care.
How Are These Files Connected?
Here's the simplified view.
The two key identifiers you'll see frequently are:
PATIENT: Links a record to a patient.ENCOUNTER: Links a clinical event to a healthcare encounter.
These relationships let us reconstruct a longitudinal patient history from multiple tables.
If you want to understand every column, the official Synthea CSV Data Dictionary is a useful reference.
7. How to Explore Synthetic Healthcare Data with Python
Now that we have generated the dataset, let's explore it. We'll use Pandas because it provides a straightforward way to work with structured healthcare data.
Step 1: Install Pandas
From the Synthea directory, create a Python virtual environment:
python3 -m venv .venv source .venv/bin/activate On Windows, activate the virtual environment using the appropriate script for your shell.
Then install Pandas:
python -m pip install pandas Step 2: Load the Datasets
Create a file called:
explore_synthea.py Add the following Python code:
from pathlib import Path import pandas as pd csv_dir = Path("output/csv") files = [ "patients", "encounters", "conditions", "observations", "medications", "procedures", ] tables = { name: pd.read_csv( csv_dir / f"{name}.csv", low_memory=False ) for name in files } for name, df in tables.items(): print(f"{name}: {len(df):,} records") Run the script:
python explore_synthea.py You should see the number of records in each dataset.
We're counting data rows here, so unlike wc -l, the header isn't included.
Step 3: Examine Patient Records
Let's look at the patient table:
patients = tables["patients"] print(patients.shape) print(patients.columns.tolist()) We can select a smaller set of columns:
patient_view = patients[ ["Id", "BIRTHDATE", "GENDER", "CITY", "STATE"] ] print(patient_view.head()) Although the original data is synthetic, I prefer not to display unnecessary fields such as simulated Social Security numbers, passport numbers, or full addresses. Only use the fields needed for a particular purpose.
Step 4: Explore Encounters
Let's examine the encounters table:
encounters = tables["encounters"] print( encounters[ ["Id", "PATIENT", "START", "ENCOUNTERCLASS"] ].head() ) We can also examine encounter categories:
print( encounters["ENCOUNTERCLASS"].value_counts() ) This helps us understand the different types of healthcare visits represented in our dataset.
Step 5: Explore Clinical Observations
Let's examine the observations table:
observations = tables["observations"] print( observations[ ["DESCRIPTION", "VALUE", "UNITS"] ].head(10) ) To see the most frequently recorded observations:
print( observations["DESCRIPTION"] .value_counts() .head(10) ) This is where healthcare data becomes interesting.
The contains demographic information, but it also contains measurements and clinical events recorded over time.
For healthcare analytics and AI, understanding what each measurement represents is as important as understanding its numerical value.
8. Reconstructing a Patient's Clinical Journey
We've explored the tables independently. But what happens when we want to understand one patient's healthcare history?
A patient might visit a physician several times, receive multiple diagnoses, undergo laboratory tests, and receive medication.
That information is distributed across different CSV files. Let's bring some of it together.
Step 1: Select a Patient
For our example, let's choose the patient with the most recorded encounters.
Add this code to the script:
patient_id = ( encounters["PATIENT"] .value_counts() .idxmax() ) print("Selected patient:", patient_id) We're selecting this patient because a larger number of visits gives us more events to explore. It doesn't necessarily mean the patient has more severe health conditions.
Step 2: Examine the Patient's Demographics
patient = patients[ patients["Id"] == patient_id ] print( patient[ ["BIRTHDATE", "GENDER", "CITY", "STATE"] ] ) Step 3: Find the Patient's Encounters
patient_encounters = encounters[ encounters["PATIENT"] == patient_id ].copy() patient_encounters["START"] = pd.to_datetime( patient_encounters["START"], utc=True ) patient_encounters = ( patient_encounters .sort_values("START") ) print( patient_encounters[ ["START", "ENCOUNTERCLASS", "DESCRIPTION"] ].head(15) ) Now we can see the patient's visits in chronological order.
Step 4: Examine Their Conditions
conditions = tables["conditions"] patient_conditions = conditions[ conditions["PATIENT"] == patient_id ] print( patient_conditions[ ["START", "DESCRIPTION"] ].sort_values("START").head(15) ) Step 5: Examine Their Observations
patient_observations = observations[ observations["PATIENT"] == patient_id ] print( patient_observations[ ["DATE", "DESCRIPTION", "VALUE", "UNITS"] ].sort_values("DATE").tail(15) ) We have now explored several pieces of one synthetic patient's medical history.
A patient's healthcare journey rarely exists in one table. Understanding it requires connecting different clinical events across time.
A single encounter may have several observations and multiple conditions, so joining both tables without considering their relationships can multiply records unexpectedly.
For this introductory example, examining each event type separately is easier to follow.
9. How to Validate Your Synthetic Healthcare Dataset
Before using any generated dataset, it's good practice to understand its structure and check important assumptions.
Check for Duplicate Patient Identifiers
duplicate_ids = ( patients["Id"].duplicated().sum() ) print("Duplicate patient IDs:", duplicate_ids) Patient identifiers should be unique within patients.csv.
Check Whether Encounters Reference Valid Patients
invalid_encounters = encounters[ ~encounters["PATIENT"].isin(patients["Id"]) ] print( "Encounters referencing unknown patients:", len(invalid_encounters) ) This verifies a basic relational integrity constraint.
Examine Missing Values
print( observations.isna().sum() .sort_values(ascending=False) .head(10) ) Missing values don't always mean bad data. For example, Synthea can generate quality-of-life observations that aren't associated with a particular encounter. These records may legitimately have an empty ENCOUNTER field.
We should understand why something is missing before deciding whether to remove or replace it. This is especially important when working with healthcare data.
10. Limitations of Synthetic Healthcare Data
Synthetic healthcare data is extremely useful, but it's important to understand what it can and can't represent.
1. Synthetic Data Isn't Real Clinical Evidence
Synthea simulates healthcare events using predefined models and rules.
The resulting data can look realistic, but it shouldn't be assumed to reproduce the full complexity of actual patient populations.
2. Simulated Patterns May Differ from Real-world Patterns
Real healthcare data can contain inconsistencies introduced by clinical workflows, patient behavior, billing practices, interoperability failures, and documentation differences.
Synthetic datasets may not capture all these complexities.
3. Synthetic Data Isn't Automatically Ready for Machine Learning
Generating data is only the first step. Before developing a machine learning model, you may still need to:
- Validate clinical concepts and coding systems
- Handle missing and inconsistent data
- Integrate related datasets
- Define the prediction target
- Engineer meaningful features
- Evaluate data representativeness and potential bias
A model that performs well on synthetic data may not generalize to real clinical settings.
4. The Generated Population Depends on Configuration
Synthea's clinical modules, population characteristics, reference date, and export settings can affect the generated records.
For reproducible experiments, document these settings along with the Synthea version and seed.
11. Conclusion
In this tutorial, we generated a synthetic healthcare population using Synthea and explored the resulting patient records.
You learned how to:
- Install and configure Synthea
- Generate a synthetic patient population
- Export healthcare records as CSV files
- Understand patients, encounters, conditions, observations, and medications
- Explore the data using Python and Pandas
- Reconstruct a synthetic patient's clinical history
- Perform basic dataset validation
Tools like Synthea give developers a practical way to explore relationships in healthcare data without relying on access to real patient records.
The dataset we have generated can now serve as a starting point for building healthcare data pipelines, testing database designs, experimenting with interoperability standards, and exploring healthcare analytics.
Additional resources